The Extended DISC® Profiles are easy to debrief, but there is even more understanding in the Profile graphs.
The Extended DISC® tool is based on the DISC Model; basically, how we describe the D,I,S, and C styles. However, not all DISC tools measure the same thing. Our tool focuses on your natural behavioral style. It is the only one we will focus on today. It's helps to predict how you prefer to do things; such as, make decisions, communicate, lead, etc. You can think of it as a road map of where you are and where you can adjust to become more successful. It provides a solid foundation for increasing your self-awareness and guiding your behavioral development.
Profiles Overview
 The Profiles are a clear way to describe and analyze your natural response mode to your environment. There are no Profiles which are better or worse or good or bad. They are based on the results of your self-assessment.
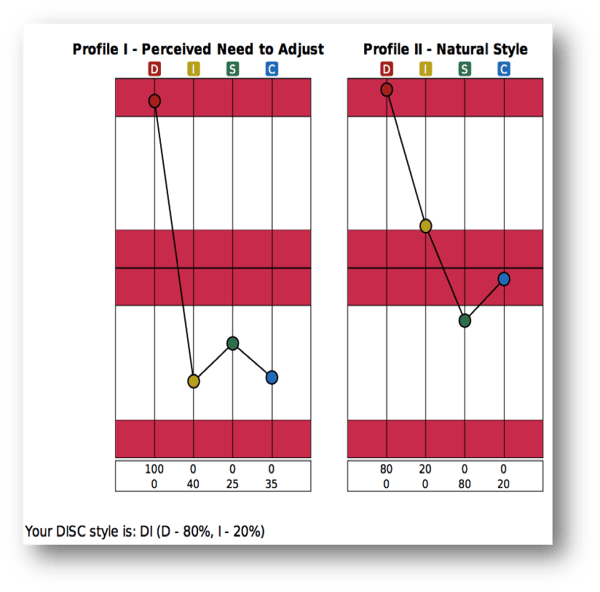
Profile II describes your natural style. It helps to predict how you naturally tend to do things, with the least amount of energy. Profile I describes your conscious self-image in your present setting. For interpretation, Profile I must always to be compared to Profile II to understand the adjustments you feel you presently feel you need to make. You can think of Profile I as who shows up on the first date; adjusting to impress and make a good first impression. Profile II is the person you've been married to for 20 years; basically, this is who they are.
The Profiles' Middle Line
 The Middle Line bisects the top half of the graph from the bottom half. Imagine it as the surface of the water; what behaviors can be easily observed by others. There are behaviors below the surface, but it not observed until we use energy to bring it above the surface. The Middle Line is the point where the styles change from observable to not-observable. In fact, the further those styles are below the surface, the more likely you are to exhibit the opposite of those style's behaviors. However, all behaviors above and below the surface exist in you; it's just some are more likely to be observed in you.
The Profile's Percentages
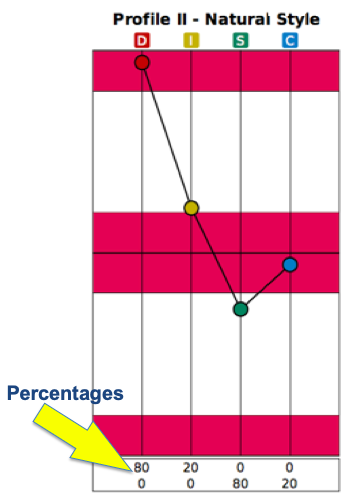
The Profile Percentages describe the relationship between the four DISC styles. They provide insight into your DISC style. The top row of percentages describe the relationship of the Natural Styles. In the example, D is 80% and I is 20% above the Middle Line; whereas, S and I do not intersect above the Middle LIne and thus, are both zero. The bottom row of percentages describe the relationship of the styles that are not natural for you. In the example above, D and I do not intersect below the Middle Line and are both zero. S is 80% and C is 20% below the Middle Line.
This example describes a person who's DISC style is DI with D being their dominant style. The person has consistently identified S, which is 80% below the Middle Line, as being their least comfortable style.
The Profile Zones
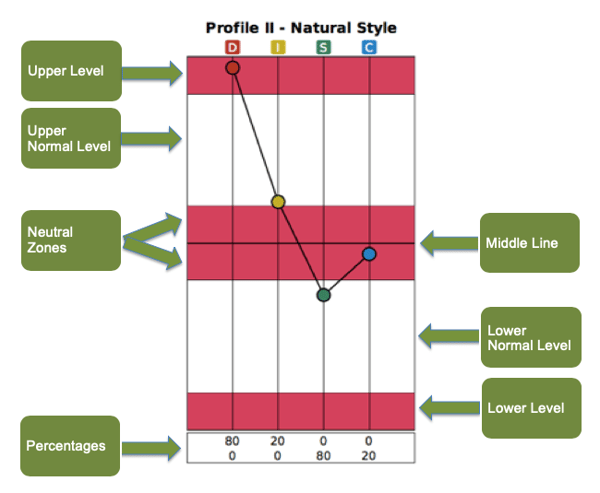 There are different levels within the Profiles. They include the Upper Level, the Upper Normal Level, the Neutral Zones, the Lower Normal Level, and the Lower Level.
If you have a style plotted in the Upper Level, like the sample's D above, it means you strongly and consistently identified with the style when you answered the Extended DISC® Questionnaire. However, we cannot determine if you are the ultimate D simply because you are plotted at the top of the graph. We also, cannot determine if this person shows up "more D" than someone who's D is plotted lower on the graph because these are an individual's graph of the relationship of their styles. There are some Profiles that peak in the Normal Level and never reach the Upper Level. It is still a valid profile because the person identified that style with a certain degree of consistency.
The 20% I is plotted in the Normal Level close to the Neutral Zone above the Middle Line. While it is a part of the person's natural style, it may not be a style they are comfortable in for longer periods of time. They may not find it too challenging to make adjustments to their I when they need to, but will revert back to their dominant D at the earliest opportunity.
C is in the Neutral Zone below the Middle Line. C is not a part of the person's natural style, but sits in an area that cannot be clearly identified. They did not consistently identify C as natural or not natural, but they may have some familiarity with their C.The Normal Lower and Lower Levels represent styles that are not comfortable for this person. The lower the plot point, the more consistently the person identified the style as not being natural and therefore, are more likely to exhibit the the opposites behaviors for those styles below the Middle Line.
Profile II: relationship among the DISC styles
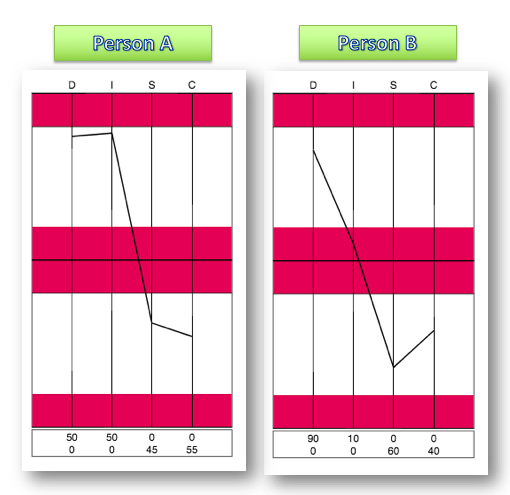
Person A's sample Profile identifies a 50 D and a 50 I. Person A is a dominant D because our algorithm states the dominant style is in the order of the DISC letters when the percentages are the same. However, this person is probably equally comfortable between their D and I style because the percentages are the same. In Person B's sample Profile, they are 90 D and 10 I. So, Person A is a DI and Person B is a DI, but you can easily see how the relationship of their Profiles are different. Person B is more likely to feel comfortable in their dominant 90 D style over their 10 I style.
The other thing to note is the plot points for Person A and Person B's D is almost plotted at the same spot on the D-axis, yet the percentages are not the same. Again, this reinforces the fact the Profiles are not numerical scales, but relationship scales.
Tips for debriefing Profiles to your clients
Your clients do not need your facilitator level of interpretation. However, your job is to highlight the Profiles in order to help them learn more about themselves. Some of the main points regarding their Profiles are:
- Focusing on Profile II - Natural Style. It describes their preferred ways of doing things. It helps them understand who they are and where they need to adjust to be more successful.
- They have all four styles; they simply have some which are more comfortable (natural) and some which take energy (non-natural).
- The Profiles and Profile Percentages describe the relationship of their Natural Styles and their Not Natural Styles.
There are more ways to interpret the Profiles, including reading key emotions, but the basic understanding of the tips listed above, is a solid foundation.